

The public display of place names is not merely a matter of orientation or administration. Settlement names appearing on road signs, public signs and official surfaces carry both practical and symbolic meanings: they indicate the local presence of a community, its historical ties to a place, and the extent to which minority language rights become visible in everyday public space. In historically multilingual border regions, the study of place names is therefore an important way of understanding the relationship between linguistic diversity, local administration and community visibility.
Within the framework of the Language Accessibility in Public Life – Language APL project, we examine questions of linguistic accessibility and multilingual public communication in the Hungary–Romania–Ukraine border region. One important research direction of the project is to explore how minority languages appear in public space. In this context, settlement-name signs are of particular importance, as they are closely connected to minority language rights, local government practice and linguistic landscape research.
The present overview focuses on three neighbouring border regions: Szabolcs-Szatmár-Bereg County in Hungary, Satu Mare County in Romania and Transcarpathia in Ukraine. These three regions form a historically interconnected and multilingual borderland, while at the same time belonging to three different state regulatory systems. This makes it possible to compare the conditions under which minority-language place names may appear in public space.
The country-specific tables below include settlements that are relevant for the study of minority-language place names according to the minority-language use thresholds or official categories applied in each country. In Hungary, the relevant threshold is 10% for nationality language use; in Romania, the decisive threshold is 20%; while in Ukraine, the key categories concern national minority communities that constitute a significant proportion of the population or are traditionally present in a given locality. In Ukraine, a separate official settlement list has been published to identify the localities where national minority communities live in significant numbers or have a traditional presence according to the relevant legislation.
It is important to note that the tables are based on the most recent census data available for each region. In Hungary, the data are based on the 2022 census; in Romania, on the 2021 census; and in Ukraine, on the 2001 census, as no new full national census has been conducted in Ukraine since then. These data may therefore not fully reflect current demographic conditions in every case, but from a legal and comparative perspective they remain the official reference points available for this analysis.
The following sections present the relevant settlements by country, supplemented by brief notes on the threshold or official classification through which the appearance of minority-language place names can be interpreted in each context.
Hungary – Szabolcs-Szatmár-Bereg County
In Hungary, the 10% threshold is relevant for nationality language use. The table below includes settlements in Szabolcs-Szatmár-Bereg County where, according to the 2022 census data, the proportion of a nationality community reaches or approaches this threshold, and where the use of minority-language place names may be relevant from the perspective of linguistic landscape research.
| Settlement (Hungarian Name) | Minority Community* | Proportion (2022 Census) |
| Nyírpilis | Roma | ~85–90% |
| Uszka | Roma | ~75–80% |
| Hodász | Roma | ~55–60% |
| Piricse | Roma | ~45–50% |
| Tiszabecs | Roma, Ukrainian | ~35–40% |
| Kántorjánosi | Roma | ~30–35% |
| Aranyosapáti | Roma | ~30% |
| Csaholc | Roma | ~25–30% |
| Györgytarló | Roma | ~20–25% |
| Jéke | Roma | ~15–20% |
| Milota | Ukrainian, Roma | ~12–15% |
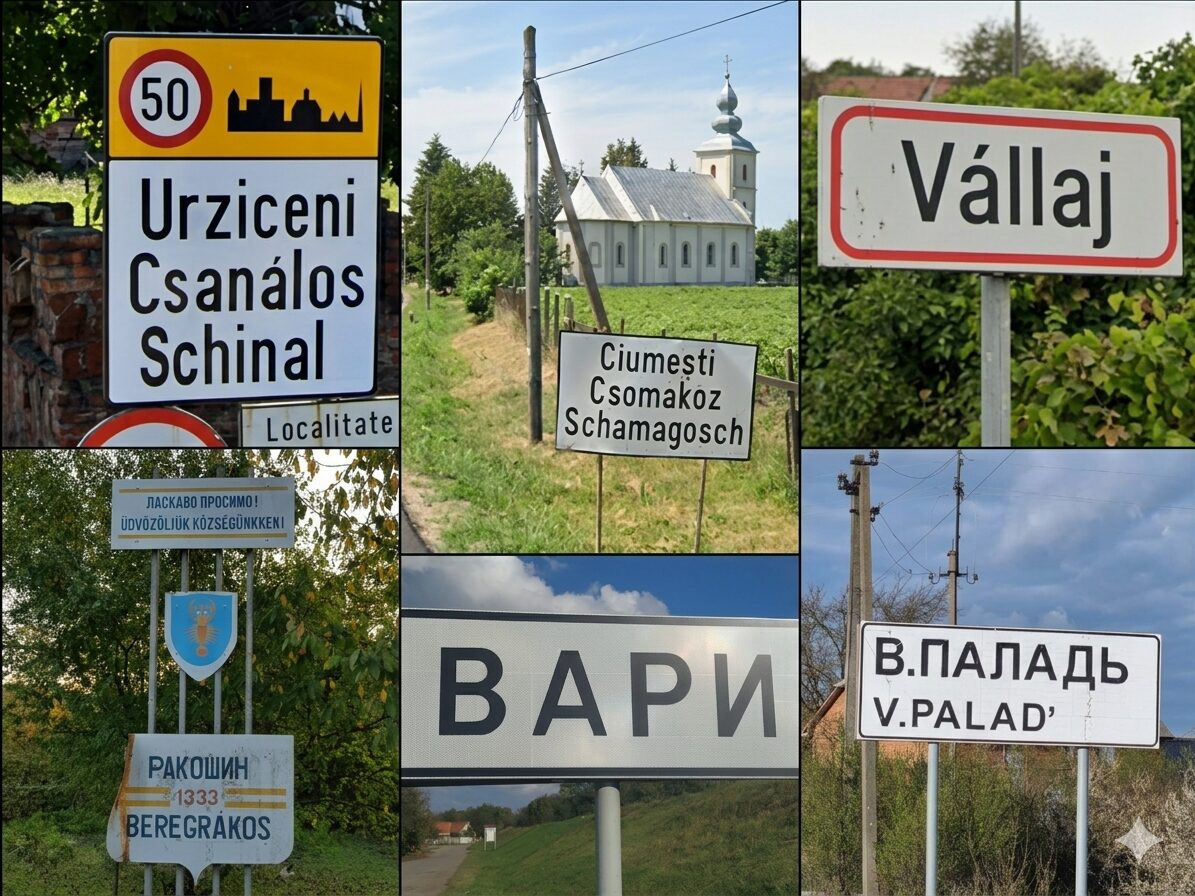
| Vállaj | German, Romanian | ~10–15% |
| Nyírmada | Roma (dominant), Ukrainian | ~28–30% |
| Nagyecsed | Roma | ~22–24% |
| Mándok | Roma, Ukrainian | ~18–20% |
| Záhony | Ukrainian, Roma | ~15–17% |
| Tiszavasvári | Roma | ~14–16% |
| Nyírbátor | Roma | ~12–14% |
| Mátészalka | Roma, German | ~10–12% |
| Nagykálló | Roma | ~10–11% |
Table 1. Institutionalizing Minority Presence: Settlements in Szabolcs-Szatmár-Bereg County (Hungary) Recognized under the 10% Threshold (Based on 2022 Census Data)
* The data are based on the self-reported nationality data of the 2022 census. In the case of Roma communities, official statistics should be interpreted with particular caution, as self-identification may be influenced by social, local and identity-related factors. For this reason, the proportions are indicative and may not always fully reflect the actual local presence of Roma communities.
Romania – Satu Mare County
In Romania, the public display of minority-language place names is linked to the 20% minority population threshold. The table below includes settlements in Satu Mare County where, according to the 2021 census data, the proportion of a minority community reaches this threshold, and where the public display of minority-language place names may therefore be examined from both a legal and linguistic landscape perspective.
| Official Name (Romanian) | Traditional Name (Hungarian, German) | Minority Community | Proportion (2021 Census) |
| Satu Mare | Szatmárnémeti | Hungarian | 36.3% |
| Carei | Nagykároly | Hungarian | 50.6% |
| Tășnad | Tasnád | Hungarian | 36.1% |
| Livada | Sárköz | Hungarian | 56.2% |
| Acâș | Ákos | Hungarian, Roma | 32.8% (Hun) / 25.4% (Roma) |
| Ardud | Erdőd* | Hungarian | 16.5%* |
| Botiz | Batiz | Hungarian | 26.4% |
| Berveni | Börvely | Hungarian | 82.3% |
| Ciumești | Csomaköz | Hungarian | 78.2% |
| Urziceni | Csanálos Schonthal | Hungarian, German | 56.3% (Hun) / 24.8% (Ger) |
| Agriș | Egri | Hungarian | 81.4% |
| Andrid | Érendréd | Hungarian | 41.2% |
| Hodod | Hadad | Hungarian | 64.5% |
Table 2. Standardized Multilingualism: Minority Proportions in Selected Settlements of Satu Mare County (Based on 2021 Census Data)
* Ardud/Erdőd does not reach the 20% minority threshold in Romania according to the 2021 census data; it is included in the table because of its historical and toponymic relevance.
Ukraine – Transcarpathia
In Ukraine, minority language use is not regulated through a single general percentage threshold in the same way as in Hungary or Romania. The relevant framework distinguishes between settlements where a national minority community constitutes a significant proportion of the population and settlements where such a community has a traditional presence. A separate official settlement list has been published in Ukraine for this purpose.
The table below includes the relevant settlements in Transcarpathia, based on the 2001 census data and the official classification. This is particularly important because the 2001 census remains the only full national census that can be used as an official source for settlement-level minority population data in Ukraine.
| Official Name (Ukrainian) | Traditional Name (Hungarian, Romanian, German or Slovak) | Transliteration | Minority Community | Legal Basis / Threshold |
| Астей | Asztély | Astei | Hungarian | Para. 3 (>15%) |
| Бадалово | Badaló | Badalovo | Hungarian | Para. 3 (>15%) |
| Бакош | Kisbakos | Bakosh | Hungarian | Para. 3 (>15%) |
| Балажер | Balazsér | Balazher | Hungarian | Para. 3 (>15%) |
| Батрадь | Bótrágy | Batrad | Hungarian | Para. 3 (>15%) |
| Бене | Bene | Bene | Hungarian | Para. 3 (>15%) |
| Берегове | Beregszász | Berehove | Hungarian | Para. 3 (>15%) |
| Берегуйфалу | Beregújfalu | Berehuifalu | Hungarian | Para. 3 (>15%) |
| Біла Церква | Fejéregyháza | Bila Tserkva | Romanian | Para. 3 (>15%) |
| Боржава | Nagyborzsova | Borzhava | Hungarian | Para. 3 (>15%) |
| Ботар | Batár | Botar | Hungarian | Para. 3 (>15%) |
| Ботфалва | Botfalva | Botfalva | Hungarian | Para. 3 (>15%) |
| Вари | Mezővári | Vary | Roma, Hungarian | Para. 3 (>15%) |
| Велика Бакта | Nagybakta | Velyka Bakta | Hungarian | Para. 3 (>15%) |
| Велика Добронь | Nagydobrony | Velyka Dobron | Hungarian | Para. 3 (>15%) |
| Великі Геївці | Nagygejőc | Velyki Heiivtsi | Hungarian | Para. 3 (>15%) |
| Галоч | Gálocs | Haloch | Hungarian | Para. 3 (>15%) |
| Геча | Mezőgecse | Hecha | Hungarian | Para. 3 (>15%) |
| Глибоке | Hluboka | Hlyboke | Slovak | Para. 3 (>15%) |
| Глибокий Потік | Strâmtura | Hlybokyi Potik | Romanian | Para. 3 (>15%) |
| Гута | Huta | Huta | Slovak | Para. 3 (>15%) |
| Демичі | Demicső | Demechi | Hungarian | Para. 3 (>15%) |
| Дийда | Beregdéda | Dyida | Hungarian | Para. 3 (>15%) |
| Добрік | Dobric | Dobrik | Romanian | Para. 3 (>15%) |
| Запсонь | Zápszony | Zapson | Hungarian | Para. 3 (>15%) |
| Затисівка | Tiszacsoma | Zatysivka | Hungarian | Para. 2 (>10%) |
| Карачин | Karácsfalva | Karachyn | Hungarian | Para. 3 (>15%) |
| Кідьош | Kígyós | Kidyosh | Hungarian | Para. 3 (>15%) |
| Косонь | Mezőkaszony | Koson | Hungarian | Para. 3 (>15%) |
| Мала Бийгань | Kisbégány | Mala Byihan | Roma, Hungarian | Para. 3 (>15%) |
| Мале Попово | Papitanya | Male Popovo | Hungarian | Para. 3 (>15%) |
| Матійово | Mátyfalva | Matiyovo | Hungarian | Para. 3 (>15%) |
| Мочола | Macsola | Mochola | Hungarian | Para. 3 (>15%) |
| Мужієво | Nagymuzsaly | Muzhiyevo | Hungarian | Para. 3 (>15%) |
| Нижня Апша | Apșa de Jos | Nyzhnia Apsha | Romanian | Para. 3 (>15%) |
| Перехрестя | Tiszakeresztúr | Perekhrestia | Hungarian | Para. 3 (>15%) |
| Пещера | Peștera | Pechera | Romanian | Para. 3 (>15%) |
| Пийтерфолво | Tiszapéterfalva | Pyiterfolvo | Hungarian | Para. 3 (>15%) |
| Плаюць | Plăiuț | Plaiutsa | Romanian | Para. 3 (>15%) |
| Подішор | Podișor | Podishor | Romanian | Para. 3 (>15%) |
| Ракошино | Beregrákos | Rakoshyno | Hungarian | Para. 3 (>15%) |
| Родникова Гута | Izvor Huta | Rodnykova Huta | Slovak | Para. 2 (>10%) |
| Свобода | Nagybakos | Svoboda | Hungarian | Para. 3 (>15%) |
| Середнє Водяне | Apșa de Mijloc | Serednie Vodiane | Romanian | Para. 3 (>15%) |
| Серне | Szernye | Serne | Roma, Hungarian | Para. 2 / Para. 3 |
| Синяк | Blaubad | Syniak | German | Para. 3 (>15%) |
| Соловка | Szalóka | Solovka | Hungarian | Para. 3 (>15%) |
| Соломоново | Tiszasalamon | Solomonovo | Hungarian | Para. 3 (>15%) |
| Солотвино | Slatina Aknaszlatina | Solotvyno | Romanian, Hungarian | Para. 3 (>15%) |
| Сторожниця | Storožnica | Storozhnytsia | Slovak | Para. 3 (>15%) |
| Стримба | Strâmba | Strymba | Romanian | Para. 3 (>15%) |
| Сюрте | Szürte | Siurte | Roma, Hungarian | Para. 2 / Para. 3 |
| Тарнівці | Ungtarnóc | Tarnivtsi | Hungarian | Para. 3 (>15%) |
| Теково | Tekeháza | Tekovo | Hungarian | Para. 3 (>15%) |
| Тийглаш | Kistéglás | Tyihlash | Hungarian | Para. 3 (>15%) |
| Тисаагтелек | Tiszaágtelek | Tysaahtelek | Hungarian | Para. 3 (>15%) |
| Тисобикень | Tiszabökény | Tysobyken | Hungarian | Para. 3 (>15%) |
| Топчино | Teteș | Topchyno | Romanian | Para. 3 (>15%) |
| Фанчиково | Fancsika | Fanchykovo | Hungarian | Para. 3 (>15%) |
| Форнош | Fornos | Fornosh | Hungarian | Para. 3 (>15%) |
| Шенборн | Schönborn | Shenborn | German | Para. 3 (>15%) |
Table 3. Codifying Minority Presence: Transcarpathian Settlements Recognized under the 10% and 15% Thresholds*
* The table was prepared on the basis of the research list developed for the methodology. Its starting point is the official Ukrainian settlement list, which includes localities where national minority communities traditionally reside or constitute a significant part of the population. The official list contains the Ukrainian settlement name, the administrative code, the national minority community, and the legal basis for inclusion; the present table supplements this information with the traditional Hungarian, Romanian, German or Slovak place names, as well as Latin-script transliterations. “Paragraph 2” refers to the legal basis of traditional presence, while “Paragraph 3” refers to the legal basis of significant population share.
Summary
The data from the three regions show that the public display of minority-language place names is shaped by legal, demographic and local administrative conditions in each case, but the regulatory logic differs from country to country. In Hungary, the framework is based on the 10% threshold and local nationality self-government initiative; in Romania, on the 20% threshold and a more mandatory regulatory approach; while in Ukraine, minority-language visibility is shaped by an official settlement list and local implementation practices.
The study of settlement-name signs is therefore not only a linguistic or administrative issue. It is also an important indicator of the public presence of minority communities, their local recognition and the practical realization of minority language rights.